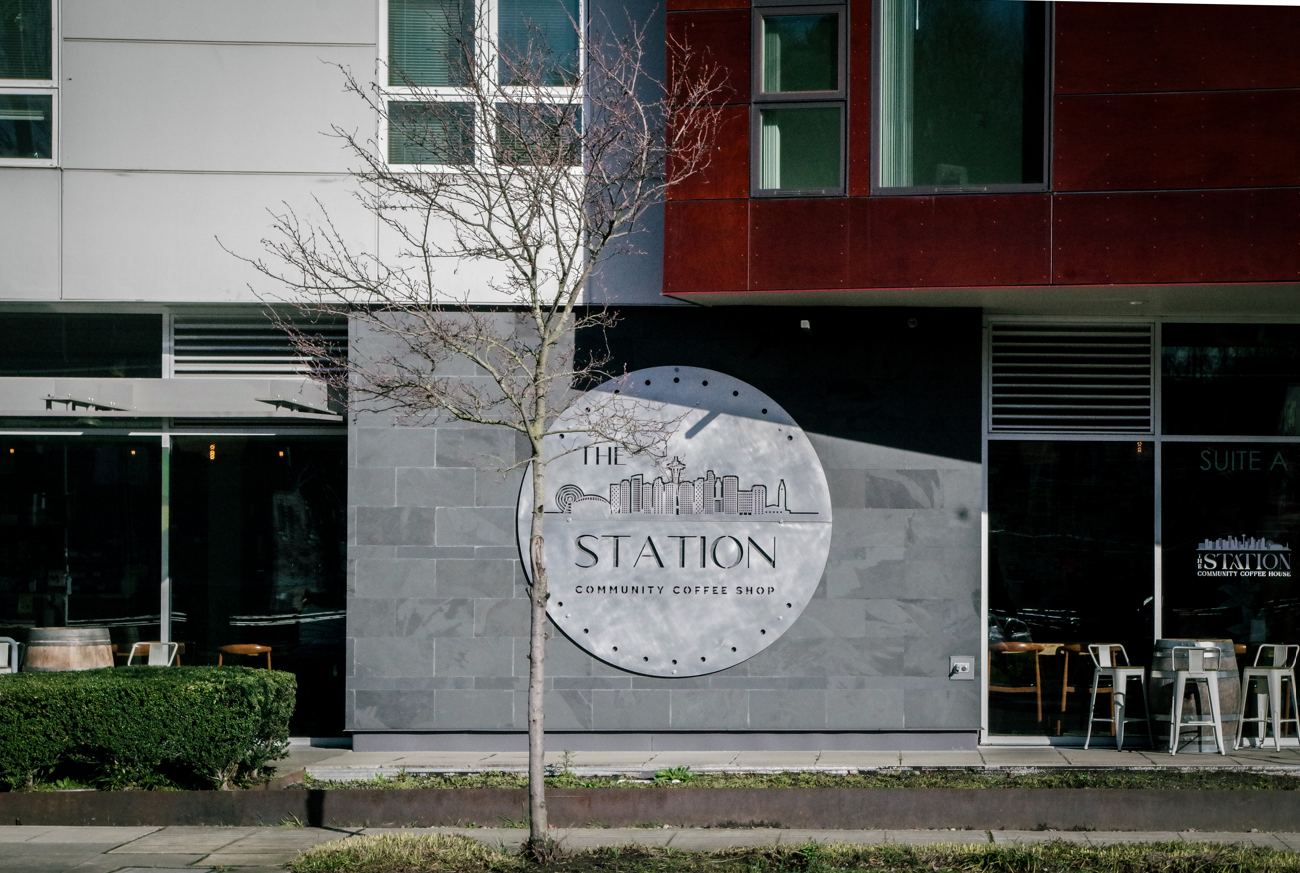
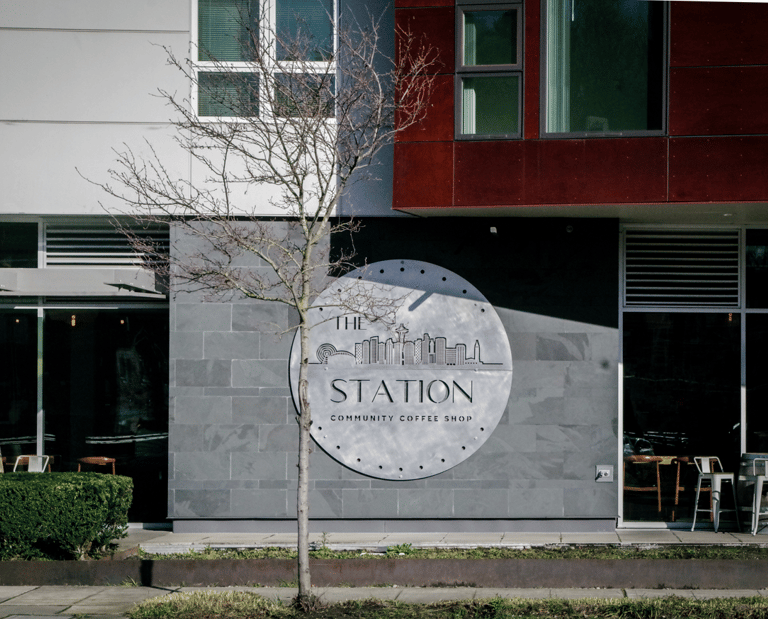
The Station Coffee Shop
Business & Marketing Analysis Case Study
Overview
A Seattle coffee shop experienced a sudden 50% decline in sales after misinformation circulating online reduced customer trust and visibility. This project focuses on identifying the root causes of the decline and implementing a data‑driven recovery strategy centered on customer acquisition, local SEO, and social media performance.
The work focuses on three pillars:
Customer acquisition (how people find the shop)
Sales patterns (what drives spikes and declines)
Marketing analysis (SEO, social media, reviews)
Customer Discovery & Behavior
Google Maps as the Primary Channel
60%+ of new customers arrive through Google Maps.
Most common search terms are category‑based, not brand‑based.
Customers discover the shop by category, not brand name.
Visibility, reviews, and SEO directly influence foot traffic.
Customer Engagement Initiatives
To understand and influence customer behavior, the following actions were implemented:
Designed and promoted a customer feedback survey.
Encouraged customers to leave Google Reviews.
Updated Google Business Profile (SEO, photos, categories).
Improved Instagram posting strategy.
Added Facebook marketing to reach older demographics.
Introduced physical marketing (in-store signage, flyers)
Marketing Strategy
Google Reviews & SEO
Reviews increased from 120 → 159 (as of March 2).
Updated keywords, categories, and business description.
Added new photos to improve ranking and trust.
Result: higher visibility for “coffee near me” and “restaurant”.
Instagram Optimization
Two locations were analyzed separately: Beacon Hill and Columbia City.
Actions included:
Consistent posting schedule
Food-focused content
Reels for reach
Stories for retention
Clear CTAs to website and directions


Performance Results
Sales Impact
February 18: Sales spike after posting the sandwich photo.
February 21: Sales spike after updating the website.
Columbia City: +11% sales increase.
Beacon Hill: +3% sales increase.
These spikes correlate directly with marketing actions, showing strong responsiveness to digital updates.
Social Media Analytics
Columbia City Location
Growth(Jan 31 → Mar 1):
Total views: 29,939
Accounts reached: 1,643
External link taps: +285.7%
Interactions: 789
Beacon Hill Location
Growth (Jan 31 → Mar 1):
Accounts reached: +52.8%
Post reach: +48%
Story reach: +31.7%
Reel reach: +20.3%
External link taps: +120%
Total reach: 53,967
Business Social Media:
Customer Behavior
Customers rely heavily on Google Maps, not brand recognition.
Reviews and SEO updates have immediate influence on foot traffic.
Food‑focused content drives rapid engagement and sales spikes
.
Marketing Effectiveness
Instagram reach and engagement increased significantly with consistent posting.
External link taps (menu, directions, website) grew sharply, indicating higher purchase intent.
Facebook and physical marketing effectively reached older demographics.
Trust Recovery
Increasing reviews helped counter misinformation.
Consistent posting rebuilt credibility and visibility.
Sales began trending upward within weeks.
Key Insights for Business & Marketing Impact


Report - Presentation
For further analysis I highly reccomed improving the data entr
