My certificates
Some of my most important certificates showing my dedication and validating my skills.
Google Data Analytics Certificate


Career Essentials in Generative AI by Microsoft and LinkedIn
Python Data structures and algorithms
Portfolio
A selection of projects showcasing my analytical and coding skills.


Data & Business Analysis


Business & Marketing Analyst - The Station Coffee Shop, Seattle, WA, USA.
The Station Coffee Shop is a local coffee shop and restaurant in Seattle.
Portfolio & Experiences

Business Analyst - Cafe Remix, Seattle, WA, USA.
Cafe Remix is a fusion of Korean and Japanese cuisine cafe.
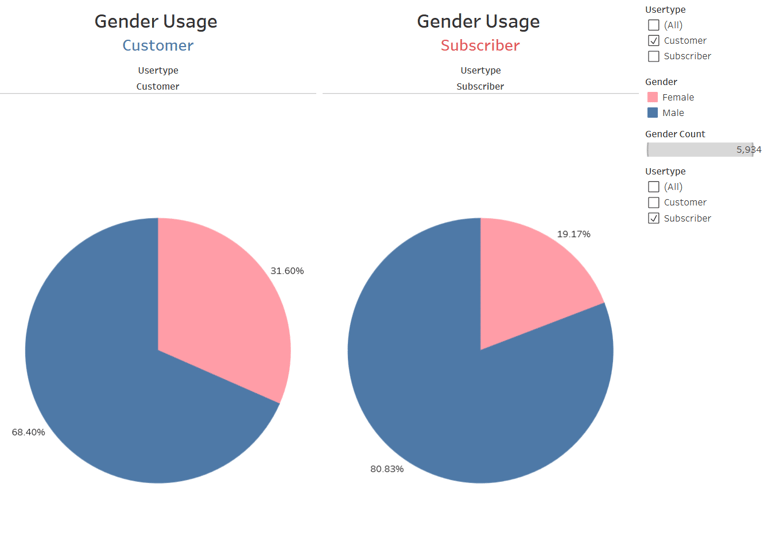
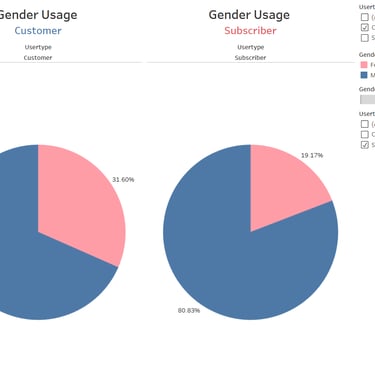
Cyclistic - Google Data Analysis Case Study, Remote.
Cyclistic is a bike shared company.
Coding Projects


Spark - POS System
Designed and created with the mission of helping a small business to run smoothly and organized.
Portfolio & Experiences


Portfolio Website
Responsive Portfolio website made with HTML, CSS, JavaScript
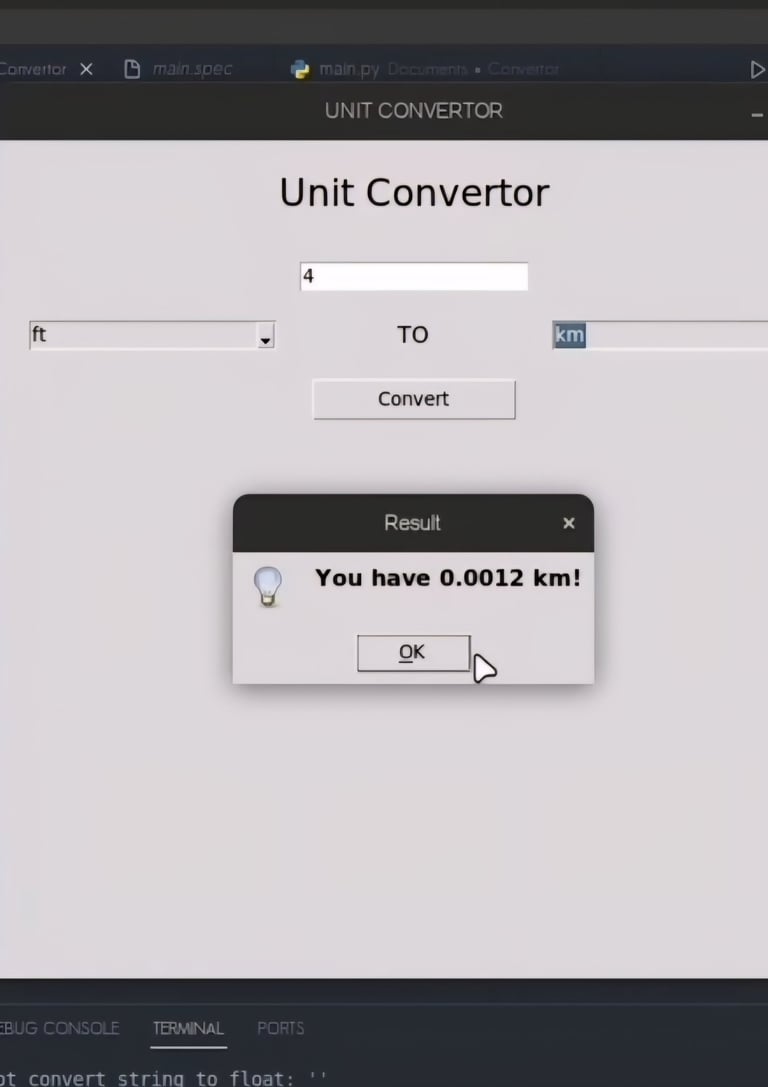
Unit Convertor
Cyclistic is a bike shared company.
What people say about me?
“I had the opportunity to work with Diego a few years ago, and I can say with complete confidence that he is a responsible, helpful, and punctual person, always committed to delivering his best performance. He stands out for his willingness to work in a team, his strong communication skills, and his proactive attitude. Without a doubt, he is someone you can trust both for his professional ethics and his human qualities.”
- Christian Cazarin
“Working with Emmanuel has been an extremely professional and efficient experience. From the very first contact, he demonstrated solid expertise in data analysis, quickly understanding the project’s needs and translating them into clear, actionable solutions. His ability to interpret complex information and turn it into useful insights made a real difference in decision-making. In addition, he is organized, punctual with deliverables, and very clear when explaining results—even to non-technical profiles. I especially highlight his strategic approach; he not only analyzes data but also understands the business context and proposes improvements based on clear evidence and real cases.Without a doubt, he is a reliable, meticulous, and methodical professional.I would strongly recommend him to any company or project seeking to make decisions backed by real data.”
- Daniel Suaste